By Christian Takushi, Macro Economist & Geopolitical Strategist. 5 May 2020 (public release was 72 hours delayed and truncated)
The US Government has released its first estimate for US GDP in Q1 2020. The way it has been reported in the press – even financial press – has often been misleading.
We have done a thorough analysis of the US GDP data, and we have also pulled all our experience & guidance to estimate the most likely Recovery Path for the US economy. The USA may not be leading the world in this crisis, but the USA is still the biggest economy and her recovery path matters to us all. We will later present you here three charts with our projections:
- US GDP 2020 – Quarter to Quarter Growth Rates (non-annualised)
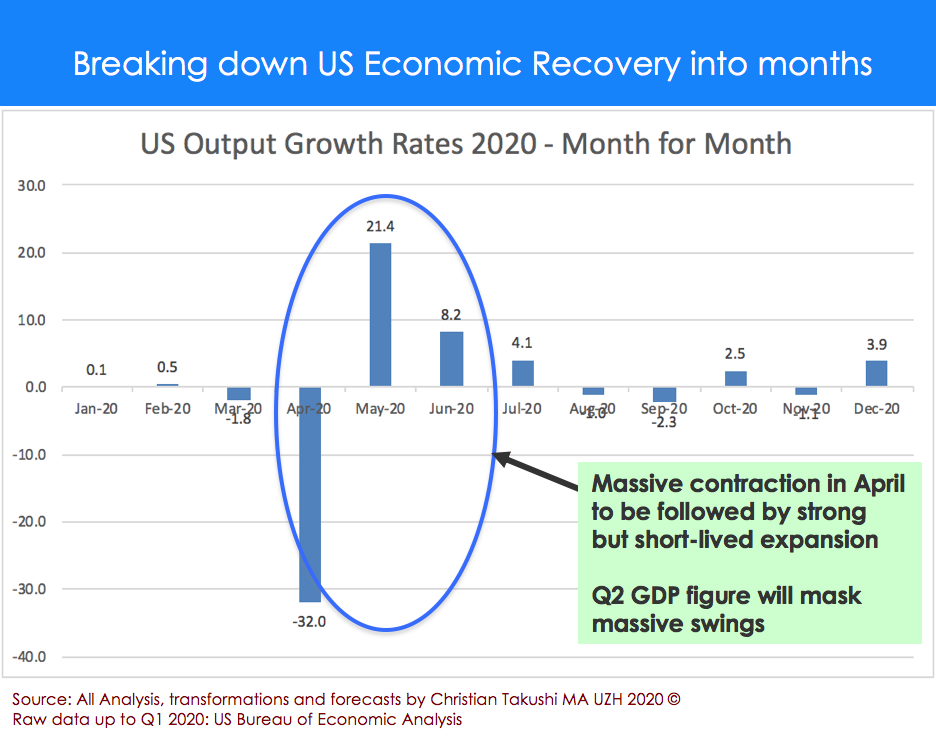
- US Output Changes in 2020 – Month by Month
- Path of US Economic Recovery – Month by Month
Most of our US forecasts have downside risks. The shattering of America’s Image around the world could also add to the painful recovery process.
US GDP for Q1 2020 raises questions
Many commentators and even experts reported that “the US economy shrank by 4.8% in the first quarter 2020”. That is misleading, the change was much smaller (see below), but reporters can be excused, because many were expecting a large contraction to be reported. But also because the US government reported the data without clearly separating what was the exact contraction and what was the annualised figure.
Given the drama of what the world is going through, it is understandable that not many commentators were able to take the time to study the data release in depth.
The US Economy was reported to have shrunk 4.8% on an annualised basis – meaning the USA would shrink by 4.8% in 2020 if the economy would sustain the same pace over the next three quarters.
Two findings about the Q1 data release:
- Firstly, behind that -4.8% annualised Q-Q change lies a very benign -1.22% contraction for the first quarter. The USA may have underreported the extent of the contraction, most likely because of the speed of events and the methods it uses. -1.2% is extraordinarily mild given the implosion that occurred during the 2nd half of March. Literally, a “massive portion” of 1/6 of the 1st quarter output was wiped away by the Corona Crisis. Imagine only 15% of output was lost in the 2nd half of March – try to reconcile that mathematically and economically with the officially reported Q1 figure. Remember GDP output is measured as a flow, and the US government might make a correction later in 2020. This reportedly “benign contraction” in light of the implosion we witnessed calls for some caution and has kept me doing much statistical analysis like in my days at university faculty. I’d like to give the government the benefit of the doubt though. It is likely that part of the implosion will be shifted into the Q2 reading. A much less likely explanation, is something we have witnessed many times in modern history – administrations try to manage the data flow in order to support sentiment. Withholding the worse data for a later quarter when the economy is recovering – barely anyone takes notice then. After all investors want good news in 2020.
- The second and the more disturbing thing about this data release has been the use the annualised figures. In stable times – when GDP growth is steady – it makes sense to use annualised figures. When an economy is on “cruise control” it is helpful to report the quarterly change as if every quarter in the year would be the same.
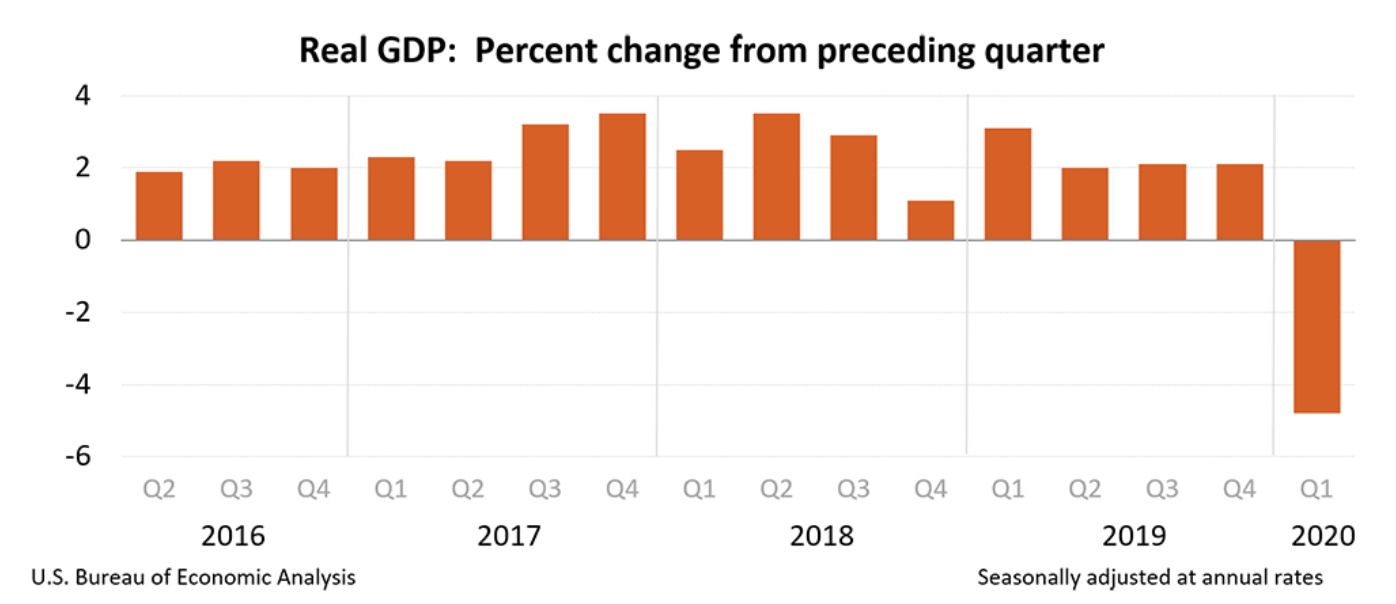
But in times of unprecedented crises, war, depression or systemic shocks (structural breakdown) to report quarterly GDP growth in annualised %-changes can be outright misleading and non-sense. Those quarterly annualised rates can easily be –4.8%, –15%, +20% etc. as the economy swings from contraction to expansion or vice-versa. This is the most powerful crisis to hit the US economy since the Great Depression, therefore I cannot understand how the US government can continue to stick to annualised quarter-to-quarter changes. It should have focused on the quarter to quarter contraction as it is. It could have added for the sake of customary continuity the annualised figure, but it should have warned not to extrapolate this quarter reading for the whole year. You can see here how stable US GDP growth has been for a number of years – back then it made sense to “annualise”. Not in 2020!

Projecting the US Economic Recovery Path
We want to support investors & businesses: They told us that they need a projection for the US GDP Recovery in 2020, both Quarter-to-Quarter, but also Month-by-Month.
I have explained to them that this is not easy, because GDP related data is only available ex-post on a quarterly basis. But if there was a time when macro economists needed to use all their conceptual & mathematical tools to predict GDP and to break down quarterly forecasts into monthly output changes without hedging themselves .. it’s now.
We have pulled all our resources and drawn on all available information from the FED, Treasury, BEA, CDC etc. to project the most likely path of the US Economic Recovery. These three charts with forecasts we are plotting for you represent only our main scenario. More importantly, a subsidiary or secondary scenario may gain in probability and new information may lead us to revise this projection. Thus, we want to stay humble and remind you that every method has downsides, and any new major event or policy failure can derail these projections.
Our current Main Scenario Forecast for US GDP in 2020: US Economy shrinks by 6.4% 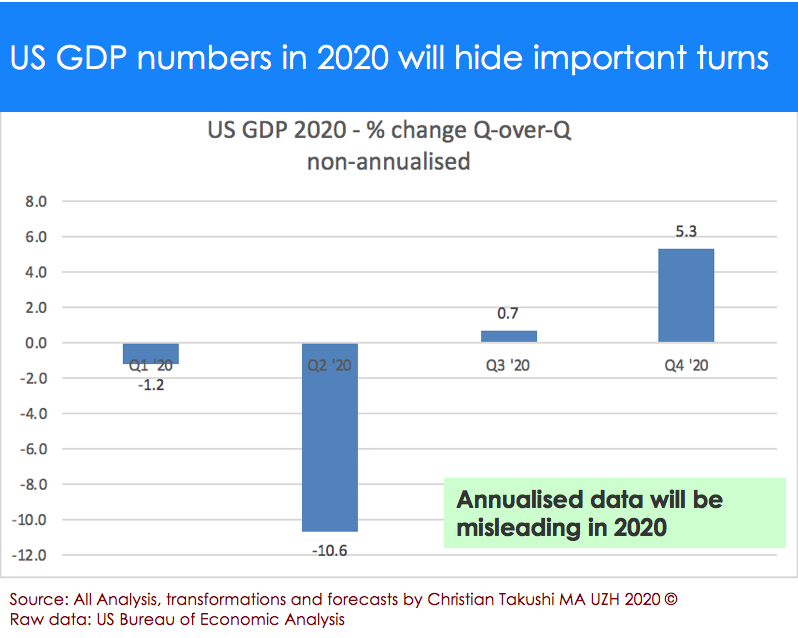
As you can see the 1st quarter has been reported as remarkably stable with a benign contraction of just 1.2% from the previous quarter. Using my 31 years experience as macro economist and our independent data base .. I did two days of Plausibility Simulations. They yielded the following: The contraction in US GDP during Q1 was between -2.1% and -3.8%. If -3.8% was true, then it was -14.4% annualised. I give the US Government the benefit of the doubt though.
Our first forecast chart seems to suggest that the US economy is going to have a steady upward recovery path. That is not the case. Our break down of the US Recovery Path into monthly changes reveals that there is going to be massive volatility and that the recovery is going to be a protracted one with setbacks along the way. It is also very likely that we may have to wait for a long time to really know the full extent of the economic implosion that occurred during the dramatic “Mid March to End of April” period. The traditional way data is compiled, I doubt that US policy makers have been able to catch the full extent of it. We should have improved GDP statistics long ago.
Downside Risks
The more time passes by, the more dysfunctional the US response seems to be. Thus, all moss our forecasts have significant downside risks. While my US unemployment peak forecast stood at 21% at the end of April, it now stands at 26%. Unlike many critical commentators, we don’t think this crisis is simply exposing the shortcomings of the current Administration. This crisis is rather shockingly exposing the vulnerabilities of the US system as a whole.
The long term consequences of this crisis will go beyond the economic, business and investment realms. The staggering proportion of the human suffering and the speed of the economic implosion have shattered America’s Image around the world.
Month-by-Month Recovery Path could weigh on the Election
The second chart shows how volatile US Output is going to be. This mainly, because of the unprecedented “free fall” of economic activity and output implosion from Mid March to End of April. 6 weeks of economic implosion that will challenge many commentators’ knowledge of statistics and math. 6 weeks that will force a rethink of GDP and how it is measured. In 2020 observers will notice that a 20% contraction cannot be matched by a 20% expansion. Yes, in the case of massive declines it takes proportionally much more effort to recover the lost ground.
The following chart shows how a 34% output expansion over three months (May-July) cannot mitigate the 32% contraction in April. Investors will say “I am glad GDP is not reported monthly”. Our methodology for estimating economic output (monthly output changes) may not align perfectly with official GDP and the set of data that supports it, but we humbly believe our estimates better reflect underlying economic conditions for the average consumer and voter (please, see the last chart of this research report: From GDP per capita to median wage).
This 2nd chart also shows how the 1st chart with the usual quarter-to-quarter changes fails to catch both the volatility of monthly outputs and the inflection points. This volatility and the turning points could become precious information for political analysis in 2020. They are likely to weigh on the Presidential Elections in November this year. And there is more in the 3rd chart …
The tremendous volatility to be experienced in the US economy in Q2 and Q3 is likely to weigh on political discourse before the elections.
Companies’ demand to massively ramp up testing and their requests for a total liability protection will shape the Back-to-Work progress and politically dominate the Spring and potentially the Summer. More and more companies are demanding to be able to test their employees twice a month. That means the need for 600 million tests every month. Can the US produce them? Theoretically yes, but US states and the Federal Government are in disagreement still – in part because many states are out of money – and have not been able to give US companies a firm order-guarantee yet. This is precious time that is being lost in Washington. By comparison, Germany gave its industry a powerful “Abnahme-Garantie” in March-April already, allowing companies to ramp up production of essential medical goods in the millions and hundreds of millions.
The economic and political drama of the Second Quarter in America will be studied for years to come. The mistakes, the partisan politics, the protracted recovery and the leaders that will step out to lead the nation out of its current somewhat self-inflicted predicament. With a healthier political system the US economy would recover much faster – Yes, I believe the US has the potential to deliver a -3.7% contraction for the whole of 2020. That would be a remarkable comeback in such a difficult year. But such is not my main scenario for America.
In the 3rd chart I am plotting the most likely Path for the US Economic Recovery month by month – Again this is with all available information as of May 4th 2020.
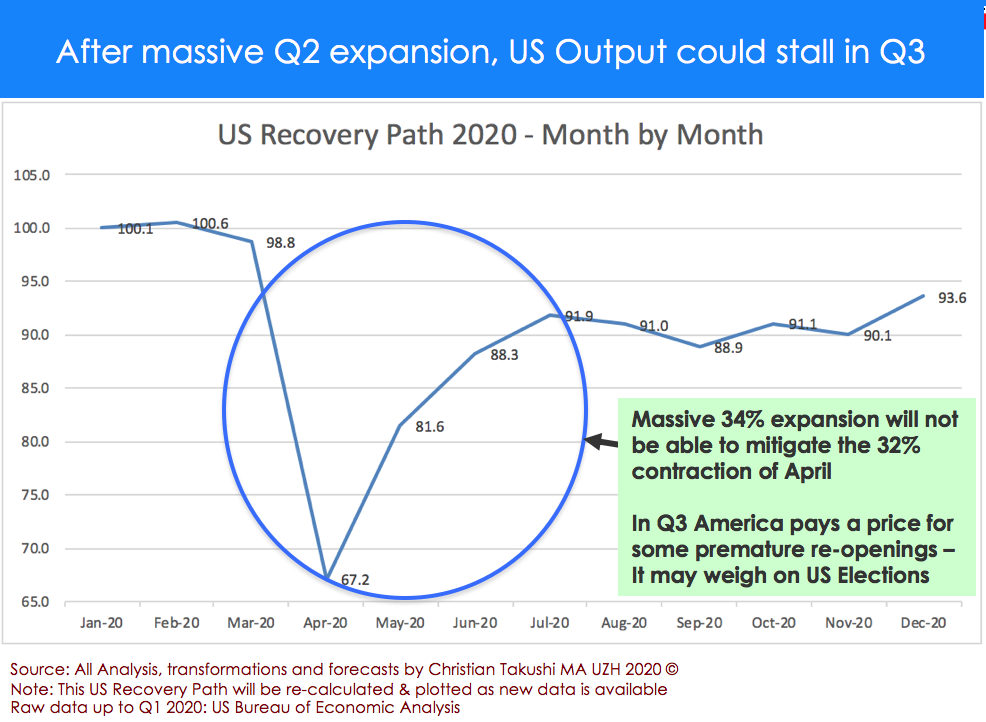
By using the 31 December 2019 as a Starting Point not only investors and business owners, but also commentators can see the extent of the recovery. Economic output was set at 100% on 31 Dec 2019. You can therefore approximately take the output level of any month in 2020 in relation to that Starting Point. We had to make some transformations and compromises to make the Economics of 2020 simple and accessible to all our readers. I thought it was worthwhile an effort.
There are different ways of measuring economic output. We have developed our own alternative methods to gauge economic activity – it helped us to see China in outright contraction early in Q1 while most Western banks were still relying on the official Beijing estimate of a weaker +4% growth. Most governments measure output as a flow based on estimates of trade volumes and transactions. Given the unprecedented collapse we have experienced, I suggest to view this chart as an Output Recovery Path. For example: By July 2020 the US economy would have recovered some 92% of her output capacity, still 8% below the beginning of the year. But this will mask the nearly 5% government-induced emergency output supporting aggregate output in July. That support will vanish as time passes by. Thus, in reality, US “organic” output will be reaching only 87% (92-5) of the level it had at the start of the year – more simply said still 13% below “normal”.
I have also decided to plot the US Recovery Path in this way, because it is the political way. Voters will gauge how the economy and their personal finances are doing in relation to the Starting Point of 2020. I am not a great friend of the way GDP is being measured – GDP is sadly a much better reflection of how profits of big corporations and trade volumes are growing, rather than how the earnings of average Americans are faring. Especially in hard times like this (see chart below), I prefer to use the methods we have developed. And to plot something that normal people can relate to. Since those people vote in November, the more important it is.
See in the following chart how GDP has deviated from workers’ reality.

The additional 5% output in July is thanks to the USD 3 Trillion rescue package. As I have said before, this improvised and politicised package will not be as efficient as the amount suggests. The biggest beneficiaries will be the big firms, drastically reducing competition in an already oligopolistic America. The Germanic macro buffers for businesses and workers are proving to be worth their money – They are well funded and quick in automatically, allowing policy makers to focus on the problem itself. What an advantage, and it leaves politics out of the equation. In the USA, politicians seize the moment first and then they decide how and whom to help.
Re-opening too early; Crisis a great opportunity
Our Recovery Path also shows that the somewhat premature re-opening in some states will lead to a second wave of the epidemic sometime in the late summer. That is likely to dent economic growth, but I expect it to be digested within 8-10 weeks. The economic damage should be far less than what we saw in March-April.
Nevertheless, it means that the US economy will only be able to expand again one full month before it enters November. The disappointing negative growth numbers for Q3 of US GDP will dominate the headlines right before the elections. The overall shape of the Economic Recovery does indeed not favor the President Trump – at least not at this point.
December 2020 is expected to be a strong month for the US economy. With the political uncertainty out of the way, and some medical solutions (vaccinations etc.) on the horizon, America should start its full-fledged recovery and reach the output level of January 2020 in the second half of 2021, latest in 2022. It is likely to be a different mix of goods and services though. And in many ways, the economy may be on a healthier and more sustainable footing in 2021, even if still below the Output level of January 2020.
This crisis is a great opportunity to change things we procrastinated for years. A great opportunity to shift away from GDP to GDP per capita (de-politicising GDP). A great opportunity to review how we measure GDP and to read economic conditions that are relevant for the average consumer and voter. A great opportunity to rebuild our local and regional supply chains. A great opportunity to boost efficiency and reduce our commute & travel. A last opportunity for mankind to seek more quality and less quantities. Also the last opportunity to de-monetise financial assets before the great Day of Reckoning that is coming unto the world. De facto broken governments in advanced and developing nations are spending money they don’t have – by printing money out of thin air and issuing debt they can’t afford.
I hope our macroeconomic and statistical work has been able to add some value to you.
We are currently monitoring several other fronts and working on multiple research projects – among them:
- Israel & the Middle East
- East East Asia – How Beijing could outsmart Washington
- Emerging Markets break up, Mercosur on life support
- From Deflation to Inflation
- The coming Debt Restructuring & Currency Reform
- Commodities, Defence & Gold
- World looks to Germany for leadership
Market Reflections
Deflation and Inflation scenarios are going to play a bigger role in the years to come. I still maintain my view that markets ..
If you want to read the full report, you may contact c.takushi@bluewin.ch
It is our great desire and prayer that all our readers and their families can stay healthy, positive and able to be a blessing to others in these challenging times.
By Christian Takushi MA UZH, Independent Macro Economist & Geopolitical Strategist. 5 May 2020 (public release was 72 hours delayed and truncated)
Disclaimer: None of our comments should be interpreted or construed as an investment recommendation
A distinct broad approach to geopolitical research
(a) All nations & groups advance their geostrategic interests with all the means at their disposal
(b) A balance between Western linear-logical and Oriental circular-historical-religious thinking is crucial given the rise of Oriental powers
(c) As a geopolitical analyst with an economic mindset Takushi does research with little regard for political ideology and conspiracy theories
(d) Independent time series data aggregation & propriety risk models
(e) Takushi only writes when his analysis deviates from Consensus